

The cheapest price per item does not always produce the cheapest order. Setup and delivery can reverse the comparison, while an unstated fee can make an incomplete quote look like a bargain.
This tutorial uses Gemini Notebook to compare three fictional suppliers for Cedar Lane Cafe’s order of 500 folded menus. The result is a sorted cost table, a separate chart and a Google Sheets copy. The practical lesson is to separate a complete quoted total from the costs you happen to know so far.
The notebook keeps the selected source documents alongside Chat and generated outputs, so you can check the comparison against the original quotes.
Watch the full AI Stack tutorial
1 Add comparable quotes as separate sources
Start with quotes for the same job. Here, all three cover 500 full-colour folded menus on 250 gsm stock, with prices in USD and tax excluded. That common specification makes the cost comparison meaningful. For a real order, check quantity, material and scope before asking AI to rank anything.
Create a notebook, choose Add sources and use Copied text to add each full quote separately. In the video, Maple charges $0.74 per menu, plus $10 setup and $15 delivery. Harbor charges $0.68 per menu, plus $45 setup and $25 delivery. Pine charges $0.62 per menu and includes delivery, but does not state its setup fee.
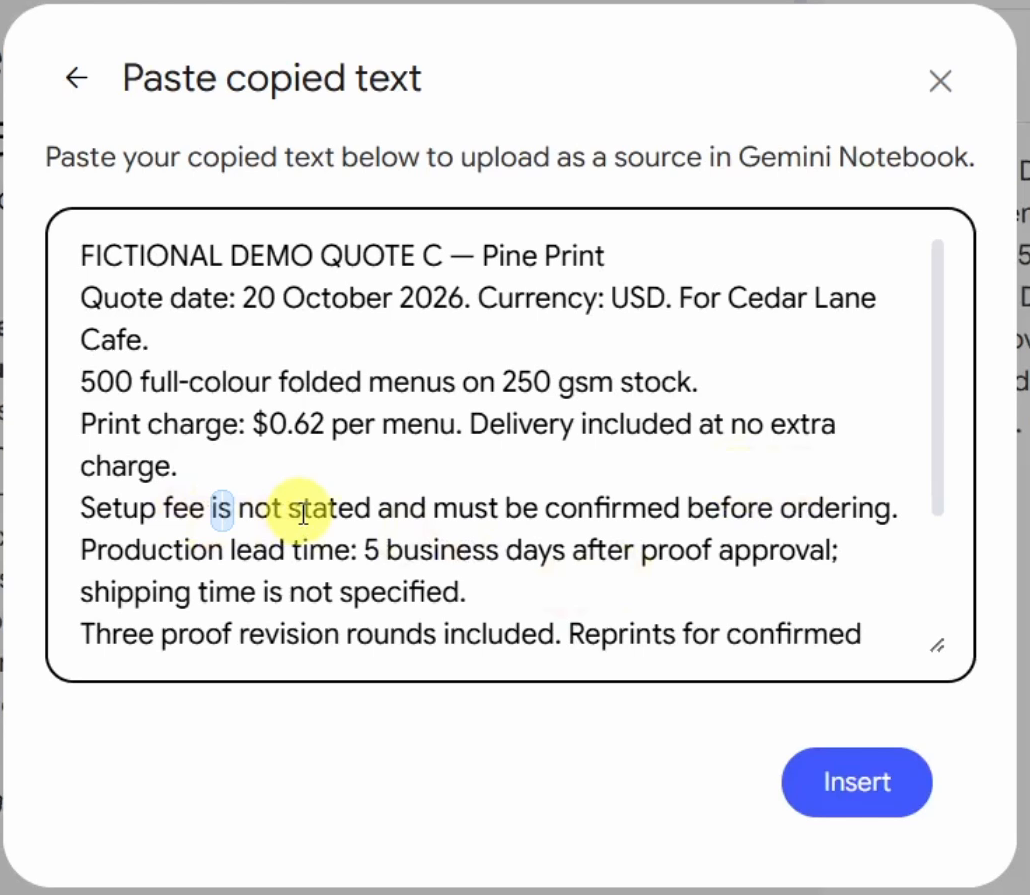
Keep all three quote sources selected. Add the original wording, including missing terms, rather than a summary or an expected answer. For your own documents, use material you have permission to upload and remove unrelated private information.
2 Tell the table how to handle missing costs
Open Data table and enter the compact comparison prompt. Seven columns keep the result readable: supplier, print subtotal, setup, delivery, known total, completeness and source. The important instruction is that complete quotes are sorted cheapest first, while incomplete quotes go last without being ranked.
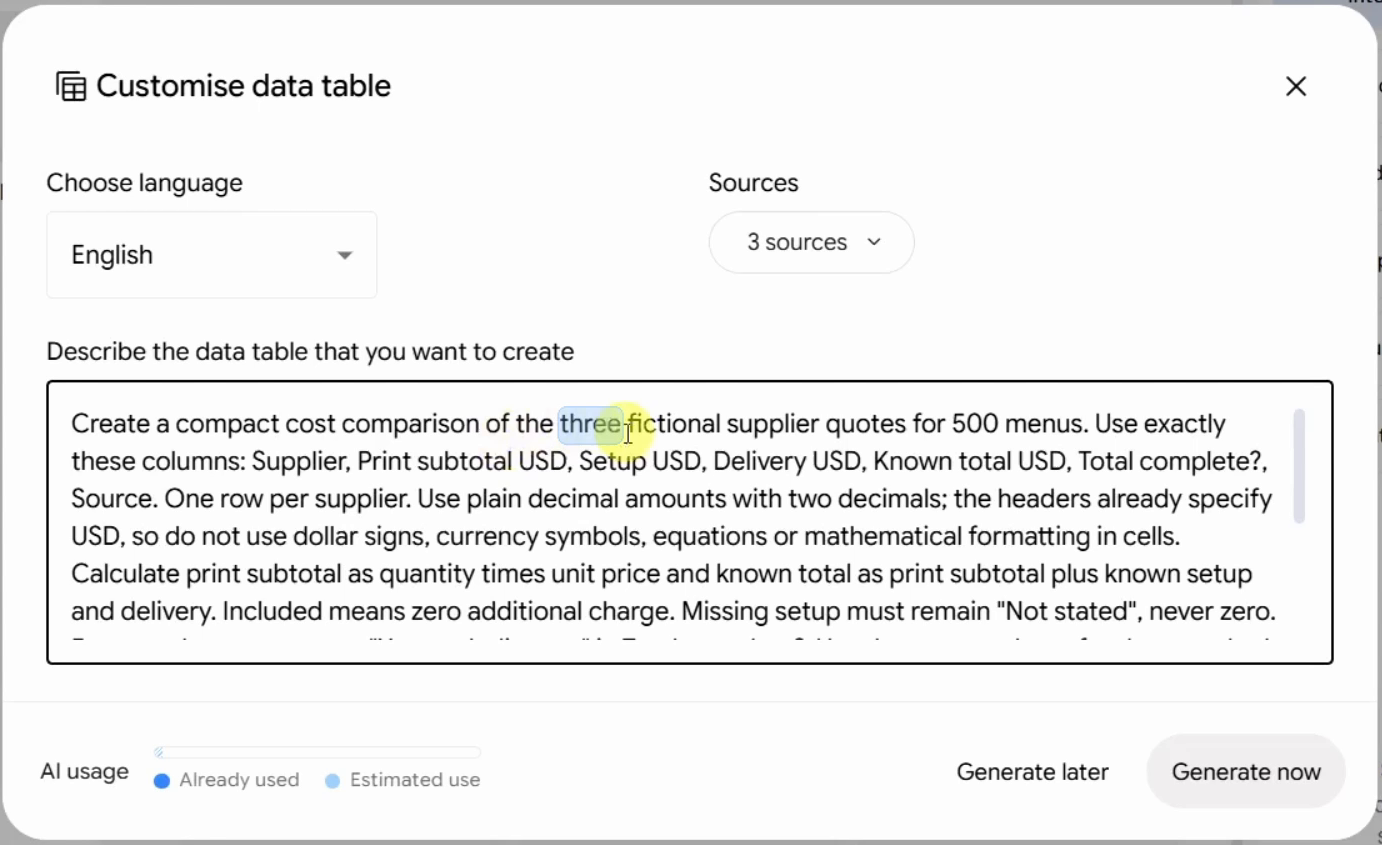
Copyable table prompt excerpt
The visible prompt in the video contains the following instructions. This excerpt stops before its clipped final sentence.
Create a compact cost comparison of the three fictional supplier quotes for 500 menus. Use exactly these columns: Supplier, Print subtotal USD, Setup USD, Delivery USD, Known total USD, Total complete?, Source. One row per supplier. Use plain decimal amounts with two decimals; the headers already specify USD, so do not use dollar signs, currency symbols, equations or mathematical formatting in cells. Calculate print subtotal as quantity times unit price and known total as print subtotal plus known setup and delivery. Included means zero additional charge. Missing setup must remain "Not stated", never zero. For complete quotes, say "Yes, excluding tax" in Total complete?. Use that same column for the unranked label on incomplete quotes. Sort suppliers with complete quoted totals from cheapest to most expensive. Place incomplete quotes last and label them "Not ranked: missing cost". Never treat an unstated charge as zero. Keep text short. Source should identify the source quote, not reproduce its full text. Do not add any other columns, invented fees, recommendations or external information.
“Included” means no additional charge. “Not stated” means the amount is unknown. Keeping those two meanings separate stops Pine’s low print subtotal from becoming a false claim about its final price.
3 Check the totals rather than trusting the ranking
The generated table places Maple first, Harbor second and Pine last with “Not ranked: missing cost”. Check each row against its quote, not just the order of the rows.
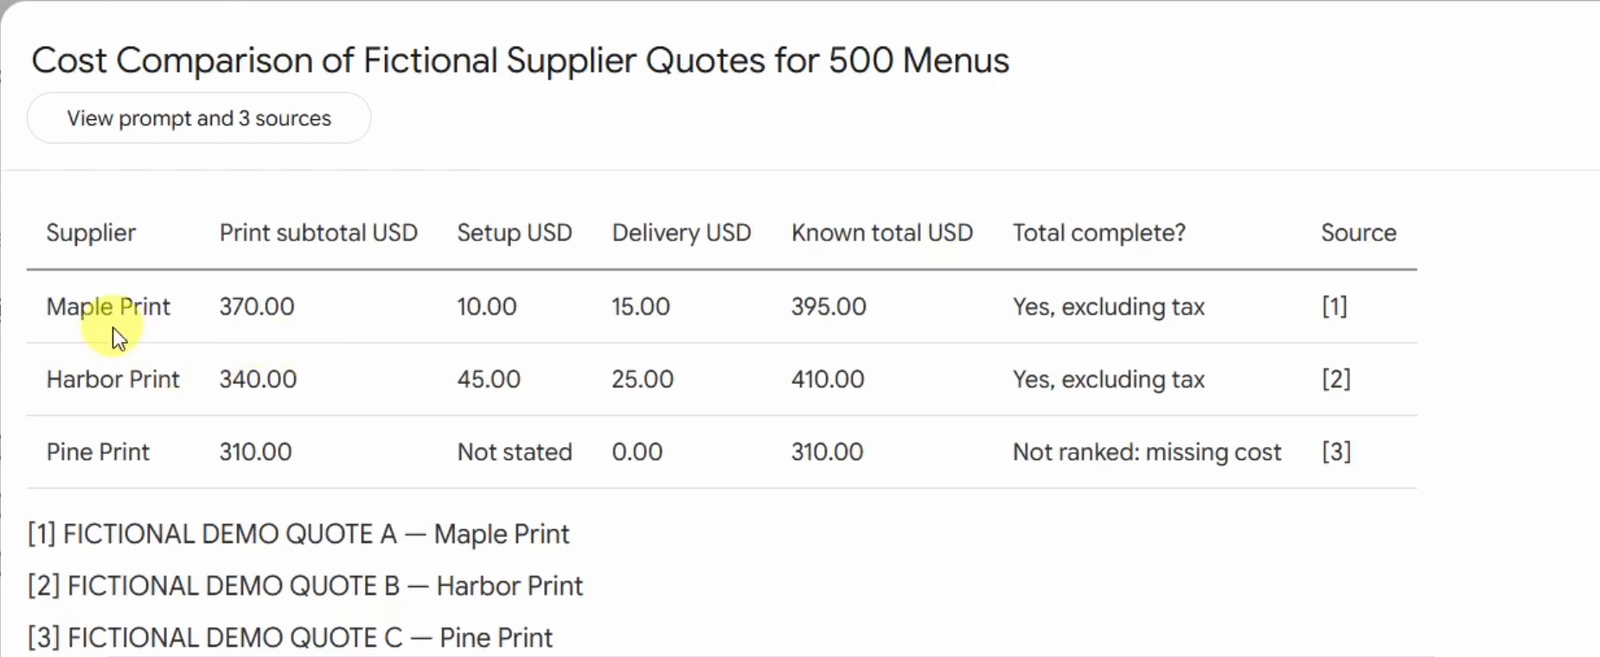
- Maple: 500 × $0.74 = $370.00; adding $10.00 setup and $15.00 delivery gives $395.00.
- Harbor: 500 × $0.68 = $340.00; adding $45.00 setup and $25.00 delivery gives $410.00.
- Pine: 500 × $0.62 = $310.00 in known costs. Delivery adds $0.00, but setup is still unknown.
Maple’s higher unit price leads to a complete quoted total that is $15.00 lower than Harbor’s. That saving comes from the whole order, after setup and delivery, not from the per-menu rate. Both totals exclude tax; tax has not been assumed to be zero.
Pine’s $310.00 is a known subtotal, not a comparable complete total. Its setup fee would have to be below $85.00 to undercut Maple, assuming no other mandatory charges and comparing before tax. Until that fee is confirmed, leave Pine out of the ranking.
4 Make the chart a separate source grounded request
The chart is requested in Notebook Chat, separately from Data table, using the same three sources. The prompt asks Chat to calculate from the quotes rather than copy an answer supplied in the conversation. It also keeps the incomplete quote out of the bars.
Copyable chart prompt excerpt
The video shows the opening of a longer chart request. Here is the visible excerpt, ending before the text scrolls out of view.
Using only the three selected fictional supplier quote sources for the 500-menu order, create an actual horizontal bar chart here in Notebook Chat and provide it as a downloadable PNG file. Derive the amounts from the source quotes, not from prior chat answers or an answer key. Calculate each supplier’s print subtotal as quantity times unit price, then add the stated setup and delivery charges. "Included" means zero additional charge; an unstated mandatory charge remains unknown and must never be treated as zero. Rank and plot only suppliers whose quoted costs are complete excluding tax. Sort those suppliers by complete quoted total ascending, with the cheapest bar at the top.
For your own run, you can add the following checks. These are suggested additions, not a verbatim transcription of the hidden remainder.
Do not plot incomplete quotes. Add a separate note naming any excluded supplier, its known subtotal and its missing charge. Start the cost axis at zero, label amounts in USD with two decimals and state that tax is excluded, not assumed zero. Show the calculations and source evidence. Provide a downloadable PNG; if that is unavailable, say so instead of inventing a link.
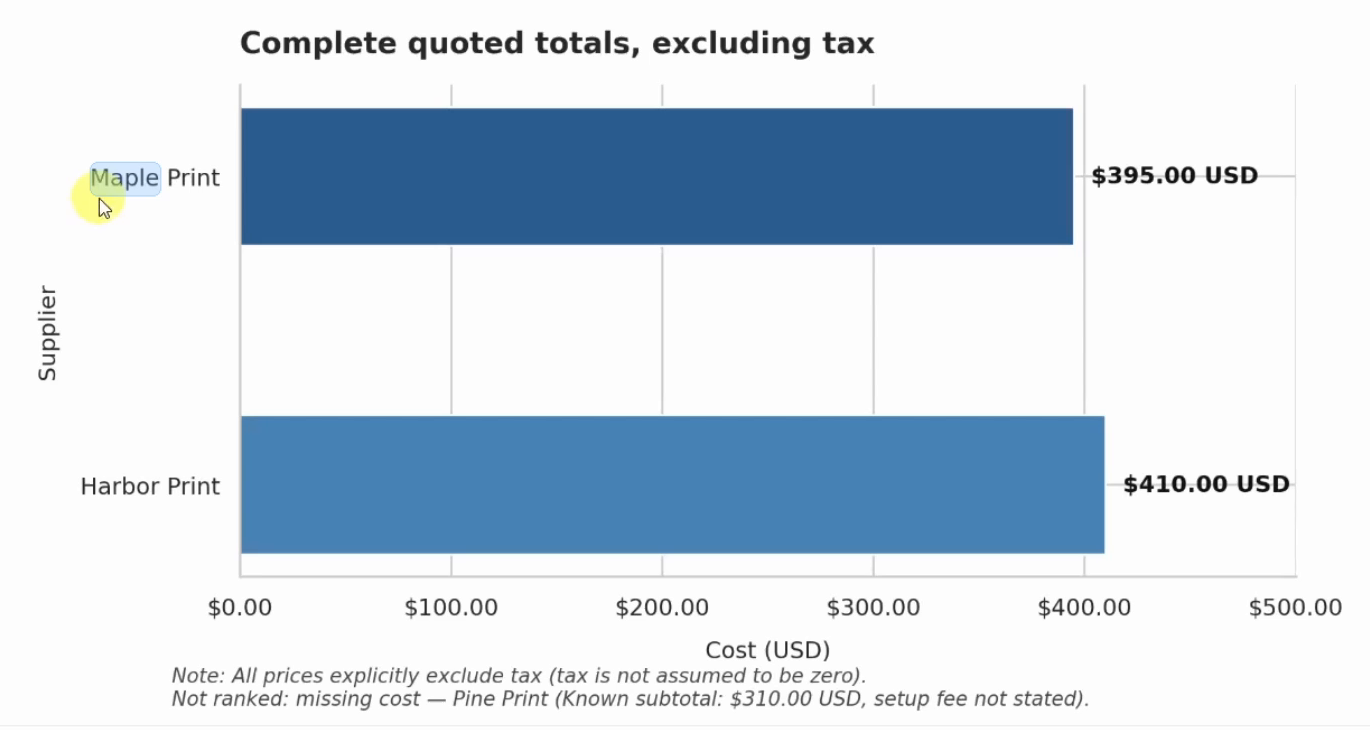
The displayed chart has two bars, a zero baseline, USD labels and an explicit tax caveat. Pine appears in a separate note instead of a misleading $310.00 bar. The video demonstrates the chart’s download option. After downloading your own copy, open it and check that the values, labels and missing-cost note remain readable.
If your Chat response provides only prose, code or a broken link, do not treat that as a finished downloadable chart. Keep the checked table and be clear about what your run actually produced.
5 Review the exported Sheet before using it
Use the table’s Export to Sheets option to create a spreadsheet copy. The video’s export contains Maple, Harbor and Pine in the same order, with known totals of 395.00, 410.00 and 310.00. Pine’s setup still reads “Not stated”.
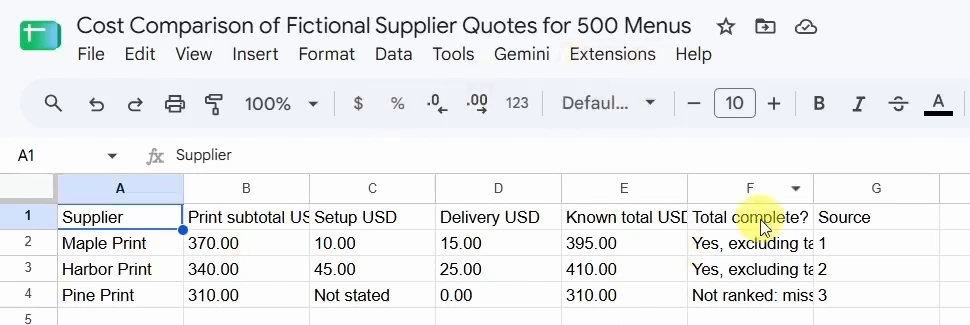
Before sharing or using your Sheet, widen or wrap the columns so the full completeness labels can be read. This is a suggested cleanup, not a step shown in the video. Check the source references against the original notebook and inspect whether calculated cells contain formulas; neither a source number nor a displayed total proves those details.
Ask the question that could change the decision
Ask Pine: “What is the setup fee for this 500-menu order, and are there any other mandatory charges?” Also check the terms that affect delivery and quality. A production lead time after proof approval is not an arrival date, and the lowest complete price does not establish the best supplier overall.
A useful comparison makes the missing information as visible as the prices. Keep unknown costs unknown, verify the arithmetic and confirm the unanswered terms before you commit.